DJH Energy Consulting
Dan J. Hartmann
P.O. Box 271
Fredericksburg, Texas 78624
210-508-7455
djhec@ktc.com.
Dan J. Hartmann
P.O. Box 271
Fredericksburg, Texas 78624
210-508-7455
djhec@ktc.com.
PORE GEOMETRY GAME BOARD
Question: How to process core analysis data to derive the best reservoir model and attributes.
Protocol:
A. Assimilate the data.
1. Gather the routine core data (porosity, permeability,oil saturation and density).
2. Find any advanced core analysis (capillary pressure, relative permeability, etc.).
3. Review any petrology reports prepared on the core (thin sections photos, SEM photos,
x-ray analysis).
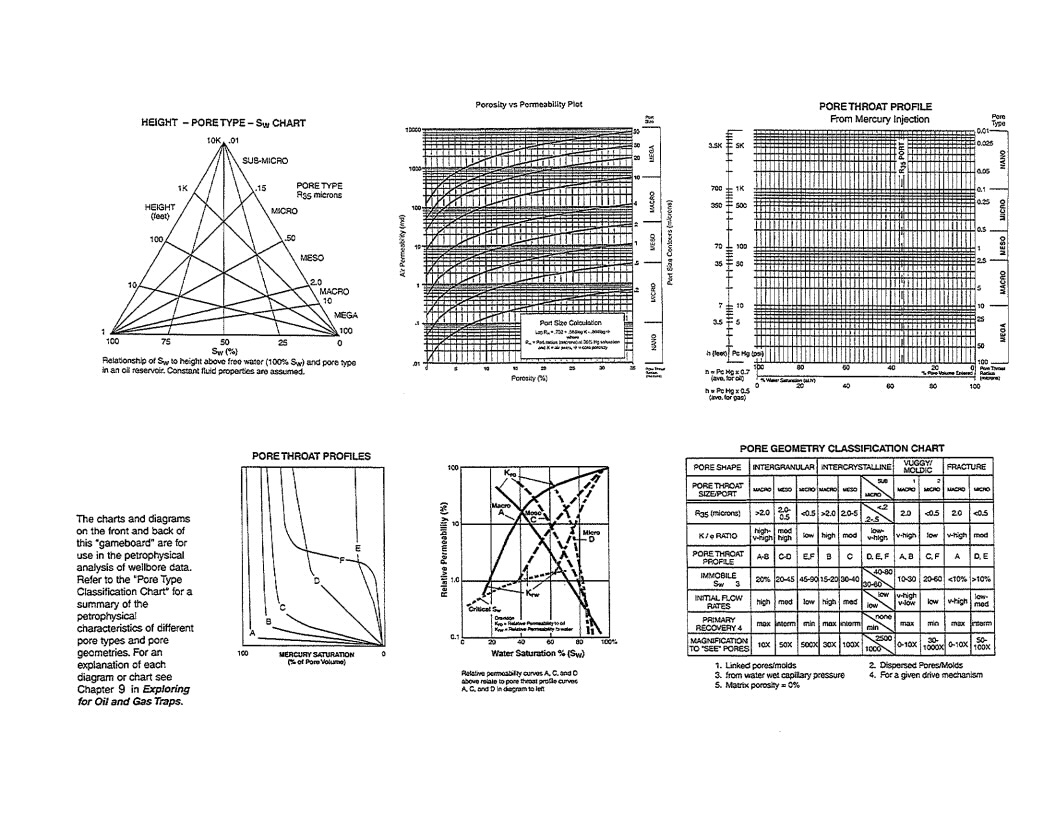
B. Plot the data.
1. Plot porosity and permeability on the Pore Throat Size Comparator to discriminate
between layers of different pore throat size.
a. Post each point on the plot, then move to the right Y axis parallel to the nearest contour
line.
b. Read the R35 value on the Y axis. This number is an estimate of the pore throat size
which controls flow through that flow unit.
c. Identify each point by flow unit number, to be able to relate it back to the appropriate
position on the logs.
d. Try to capture populations of pore throat size by drawing ellipses parallel to the contour
line.
2. Transpose the pore throat sizes to the Pore Throat Profile plot to discriminate the samples
by capillary pressure type curve. The R35 estimated size corresponds to the R35 vertical
line on the plot.
a. Enter the point at the appropriate pore throat size on the Y axis.
b. Move the point horizontally to the R35 line and post the point and label with the flow unit
number.
c. Fit a capillary pressure curve to each population of points and estimate.
-Estimate Sw at various elevations in the reservoir.
-Estimate recovery efficiency for each population.
Question: How to process core analysis data to derive the best reservoir model and attributes.
Protocol:
A. Assimilate the data.
1. Gather the routine core data (porosity, permeability,oil saturation and density).
2. Find any advanced core analysis (capillary pressure, relative permeability, etc.).
3. Review any petrology reports prepared on the core (thin sections photos, SEM photos,
x-ray analysis).
B. Plot the data.
1. Plot porosity and permeability on the Pore Throat Size Comparator to discriminate
between layers of different pore throat size.
a. Post each point on the plot, then move to the right Y axis parallel to the nearest contour
line.
b. Read the R35 value on the Y axis. This number is an estimate of the pore throat size
which controls flow through that flow unit.
c. Identify each point by flow unit number, to be able to relate it back to the appropriate
position on the logs.
d. Try to capture populations of pore throat size by drawing ellipses parallel to the contour
line.
2. Transpose the pore throat sizes to the Pore Throat Profile plot to discriminate the samples
by capillary pressure type curve. The R35 estimated size corresponds to the R35 vertical
line on the plot.
a. Enter the point at the appropriate pore throat size on the Y axis.
b. Move the point horizontally to the R35 line and post the point and label with the flow unit
number.
c. Fit a capillary pressure curve to each population of points and estimate.
-Estimate Sw at various elevations in the reservoir.
-Estimate recovery efficiency for each population.